I set up an ESP32-cam to record a picture once a minute of a solution of mannitol in a petri dish. Crystallization began after several days of no activity. This video shows the crystallization that occurred over a period of 43 hours.
Video of crystallization
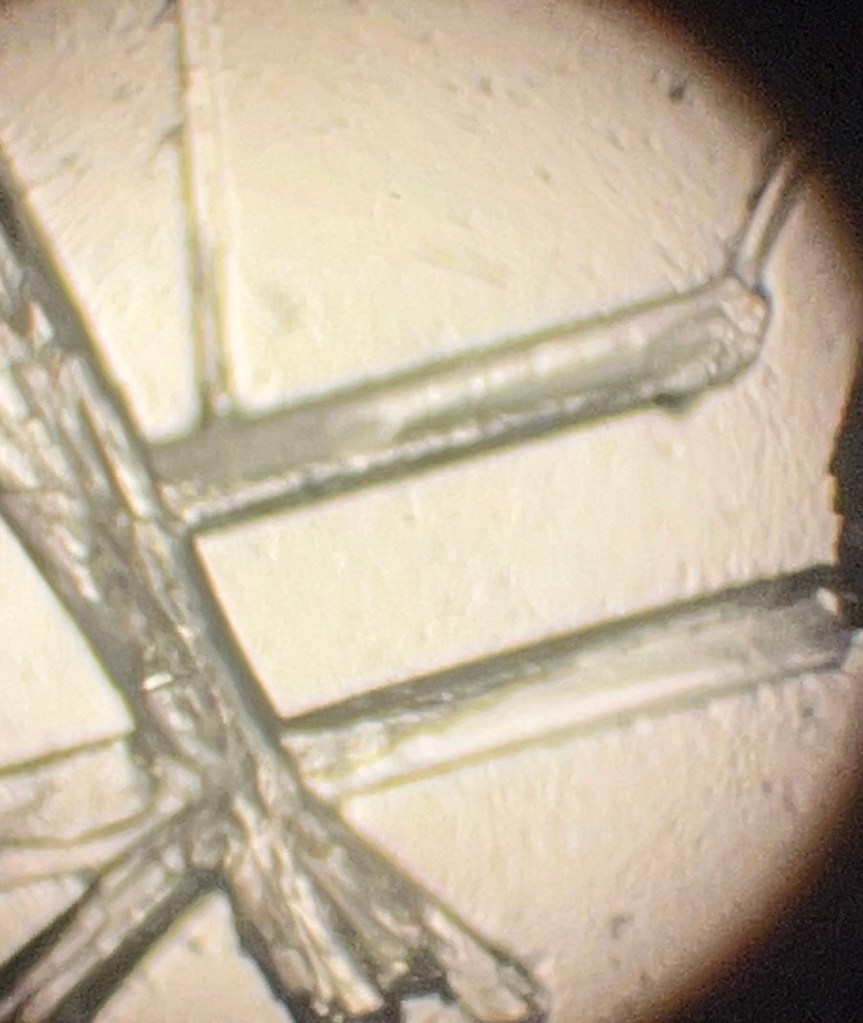
Microscopic images of crystals
Here are some pictures of individual crystals:


Analysis of rate of crystallization

This graph represents an approximation of the percent of the petri dish covered by crystals at each hour. The details are described below. The first 10 hours show a very good approximation of a logistic curve which is what I predicted. However, there is then a switch to a very linear relationship for another 10 hours. After watching the video, I suspect that this linear period represents a time when the water was low enough that the crystals could not move but only precipitated where they are. This is followed by a transition to a region that is no longer monotonically increasing. This behavior obviously does not indicate a decrease in crystal coverage and make perhaps indicate a change in reflections as the water is drying up. I am not too concerned about this region unless it recurs.
The experimental setup

I made a simple stand out of PVC pipe which allows me to adjust the distance from the camera to the specimen by changing the length of the extension.
I designed and 3D printed an adapter that would hold the ESP32-CAM and attach it to the PVC pipe.
The program for the ESP32-CAM was modified from a couple of example programs from www.randomnerdtutorials.com. The program records a picture at a set rate (in this case, 1 image per minute) and records it on an SD card.
The images were then merged into a video using Adobe Photoshop, condensing the 43 hours of images into a 1.5 minute video.
I wrote a Python program to analyze the percent of the petri dish that was covered in crystals. In actuality, each image (including an area outside of the petri dish) is analyzed for the percent of pixels above some saturation threshold. This gives a percent that is less than the true percent of the petri dish, but only scaled by a factor. The shape of the curve is conserved. I analyzed every 60th image, equivalent to 1 image each hour, and plotted the results.
The crystals were photographed with an iPhone through a dissecting microscope at 40x.
I also wrote a Python program to measure the angles in the photographs of the crystals.

Leave a comment