A demonstration of using a load cell and Arduino to collect data at home.
- Motivation
- Experimental Design
- Trial 1: A Pilot Study
- Trial 2: Adjusting rate and total production
- Trial 3: Using a Load Cell
- Trial 4: Adding a Data Logger
- Trial 5: Checking Reproducibility
- Discussion
- Footnotes
- Code
Motivation
Observing CO2 production by yeast is a simple elementary school science project. I wanted to see what I could do to quantify the experiment.
Experimental Design
The core of the experiment is to measure the volume of CO2 collected in an inverted water-filled 100 mL graduated cylinder connected by a hose to an Erlenmeyer flask containing sucrose and baker’s yeast.
Different trials used different techniques to record the collection of gas. I also refined the proportions of sucrose, yeast and water used.
Trial 1: A Pilot Study
Experimental Design
The graduated cylinder was clamped to a ring stand.
The recording was made using an ESP32-CAM1 which took a still image every 2 minutes over 2 hours. These images were then reviewed to record the time when each milliliter was collected.
The ESP32-CAM is a small but powerful Arduino-compatible microcontroller that has a camera, microSD card slot, and WiFi capability. I use the WiFi to stream an image so I can make sure that the camera is lined up on the target.

I built a stand to hold the ESP32-CAM out of PVC and a 3D printed part to connect the ESP32-CAM to the PVC.

Materials Used
2 grams of yeast and 14 grams of sugar were added to 200 mL of water at 37°C.
Results of Trial 1

Numbers on the x axis represent the image file names. The y axis is in milliliters.
Analysis of Trial 1
This was a pilot study. The quantities of yeast and sugar were initially large. There is barely any curve in the graph. The total production of CO2 was greater than 100 mL, making it impossible to observe the final stages of CO2 production. Both the rate of CO2 production and the total volume needed to be reduced.
This method is labor intensive and prone to errors due to the difficulty in reading the graduated cylinder accurately.
Trial 2: Adjusting rate and total production
Experimental Design
I used the same design as above. This time the experiment ran for 38 hours. I recorded images every 1 minute.
Materials Used
Once again, 200 mL of water was used. I reduced the yeast to 0.2 grams. By reducing the yeast by a factor of 10, I expected the CO2 production to be much slower. I reduced the sucrose by a factor of about 5, to 3 grams.
Results of Trial 2
80 mL of water was displaced, an average rate of 2.2 mL per hour.
Unfortunately, the TF card was corrupted and all images were lost.
Analysis of Trial 2
The loss of data was disappointing, but also a relief. Reviewing the images to determine when each milliliter was produced is tedious.
Trial 3: Using a Load Cell
Experimental Design
Because reviewing images to determine the volume of CO2 produced is labor intensive and error prone, I wanted a method to electronically record the data directly.
I decided to use a load cell, which is used to measure force. These are often used in kitchen scales. I bought a set of 2 load cells and 2 HX711 amplifier modules from Amazon for $12. The load cells I used are rated for 5 kg. Load cells rated for 1 kg, 10 kg, 20 kg and 50 kg are also readily available.
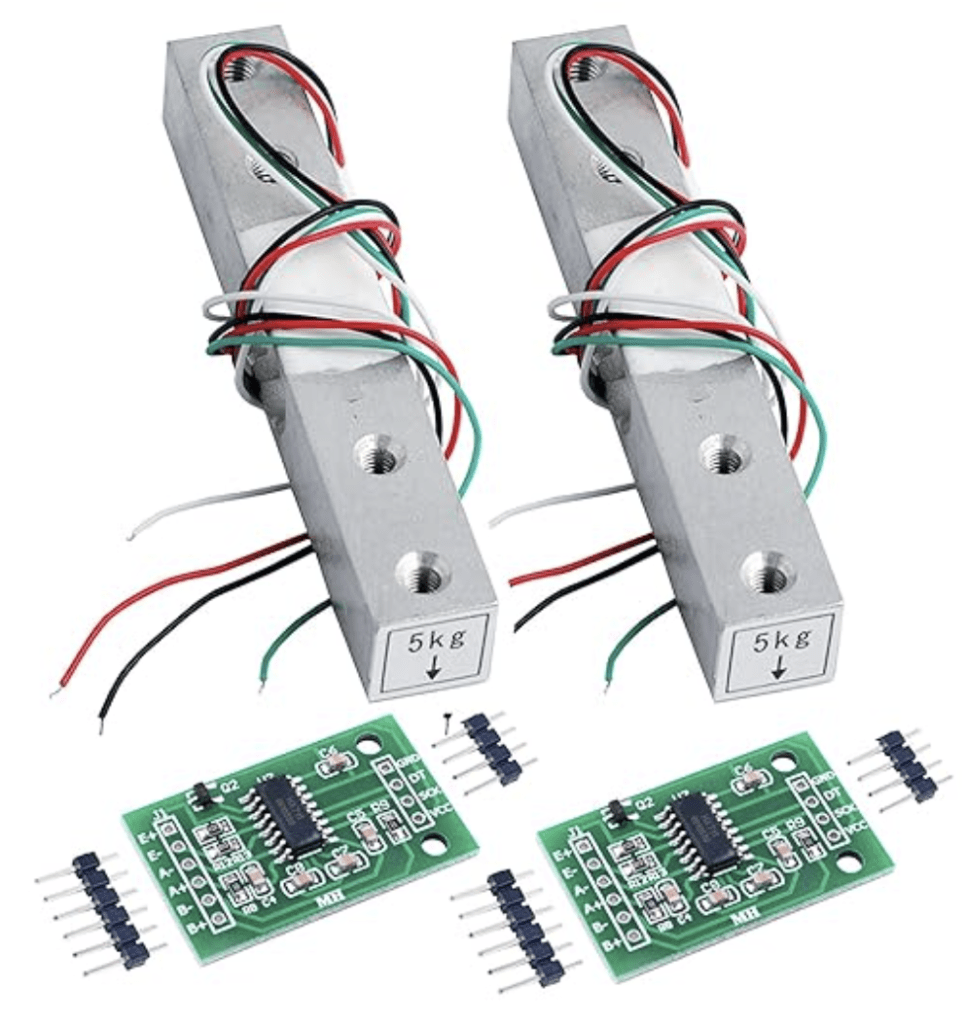
The connections between the load cell, the HX711, and the Arduino are fairly simple. This is a great resource for getting started with a load cell: Arduino with Load Cell and HX711 Amplifier (Digital Scale) | Random Nerd Tutorials


I built a crude stand to support the load cell and suspended the inverted graduated cylinder from the load cell.

Materials Uses
Using the ideal gas equation, 100 mL of CO2 at STP = 0.004 moles of CO2 . Each mole of sucrose produces 6 moles of CO2 . I therefore needed 0.0007 moles of sucrose, which equals 0.24 grams. This would limit the total CO2 production.
The rate of production of CO2 depends on the concentration of sucrose as well as the number of active yeast cells. I reduced the amount of water to 18 mL to increase the concentration of sucrose while limiting the total CO2 production.
I wanted the experiment to run faster so I increased the yeast to 1.69 grams. This would put the experiment more in line with the first trial (which used 2 grams of yeast and lasted 2 hours) than with the second trial (which used 0.2 grams of yeast and lasted 38 hours).
Results of Trial 3
This is the curve that was produced on the serial plotter on the Arduino IDE, running the experiment for 6 hours. This is actually a screenshot of the serial plotter and no data was actually recorded in a way that could be manipulated.
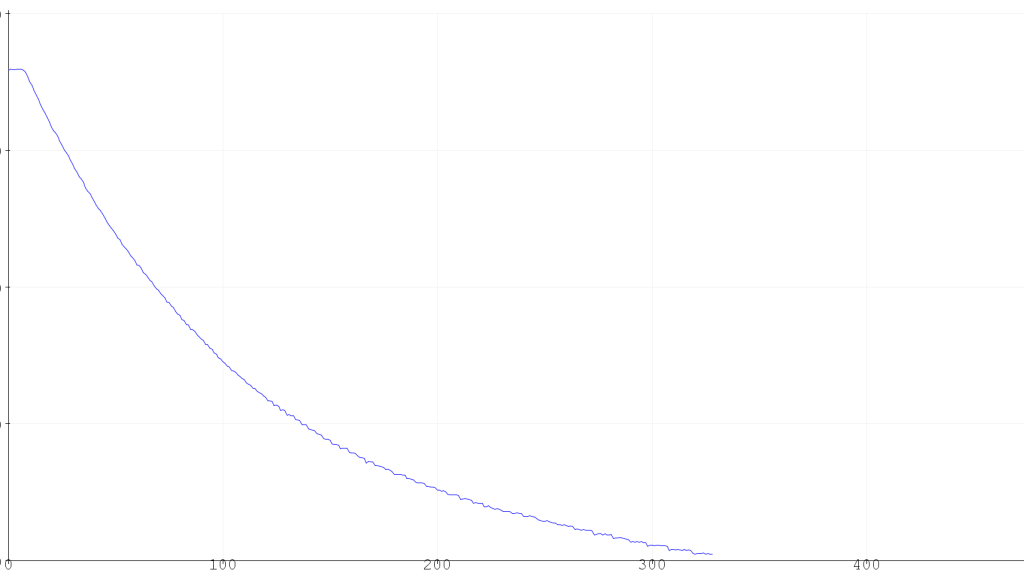
The curve is decreasing because it is measuring the force applied by the hanging graduated cylinder which decreases as water is displaced by CO2.
I let the experiment continue to run after I stopped collecting data. A total of 90 mL of gas had been produced after 12 hours.
Analysis of Trial 3
This was a proof of principle trial. It showed that the load cell was working and would produce a nice curve. However, it required that my computer be connected to the experiment and the data was not recorded. I could have written the data to the serial monitor and then copied and pasted it. But I didn’t like my computer being tied up the entire time.
Trial 4: Adding a Data Logger
Experimental Design
In order to record the data without committing my computer to the experiment, I used an Adafruit data logger that I have had for years but had never really put to use.
Overview | Adafruit Data Logger Shield | Adafruit Learning System

I modified the sample code, which I found to have several errors, and combined it with the code to read the load cell, which I obtained from Random Nerd Tutorials2. The code I used is tucked out of the way at the very end of this post.
Materials Used
I used 0.26 g sucrose, 0.5 g yeast in 19 mL water.
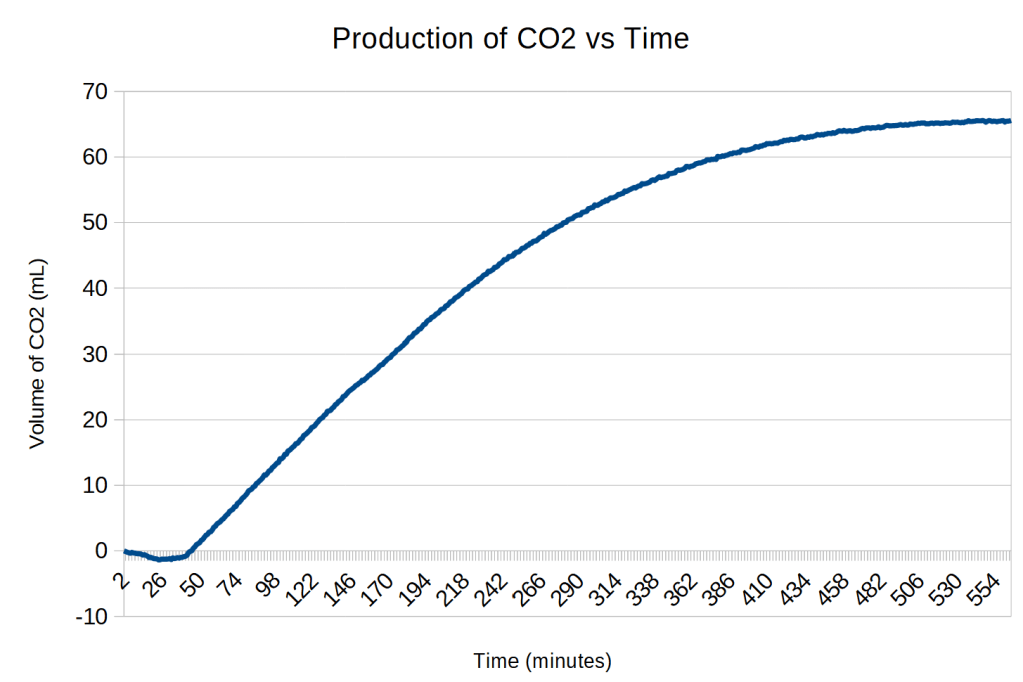
Results of Trial 4
The experiment ran for approximately 9.4 hours, recording once per minute, collecting 563 data points.
Here is the raw data:

The scale on the y axis are the readings directly from the load cell. To calibrate the data, it was divided by a conversion factor. A total of 67 mL of CO2 was produced. The range of values from the load cell is 299941 to 329810, a difference of 29869. The conversion factor is 29869/67 = 446 force units/mL.
Analysis of Trial 4
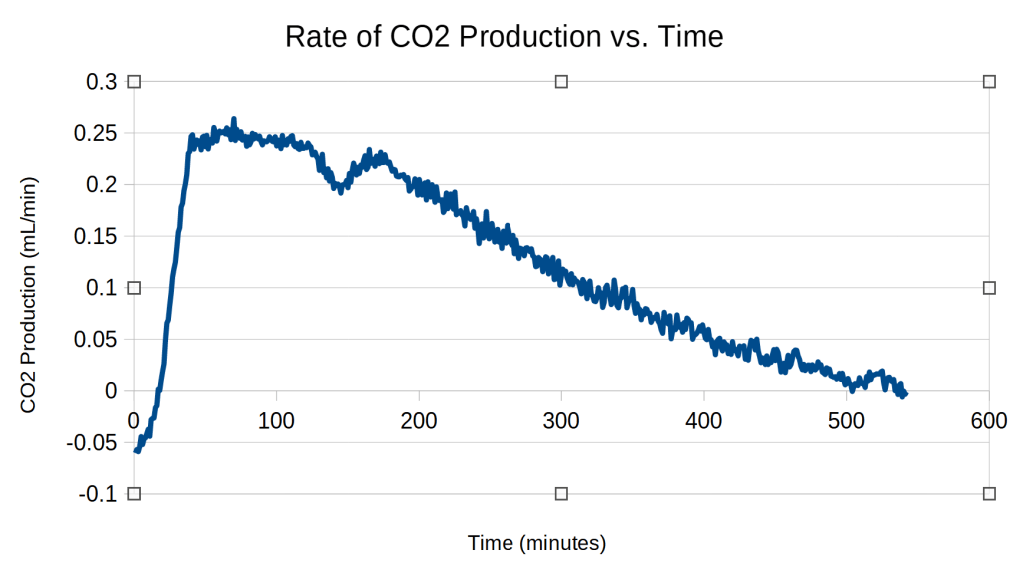
It is unclear why the force increased for the first 23 minutes of the experiment.
There is then a relatively flat phase for the next 19 minutes although the force is slowly going down. I assume this is when the yeast is becoming active.3
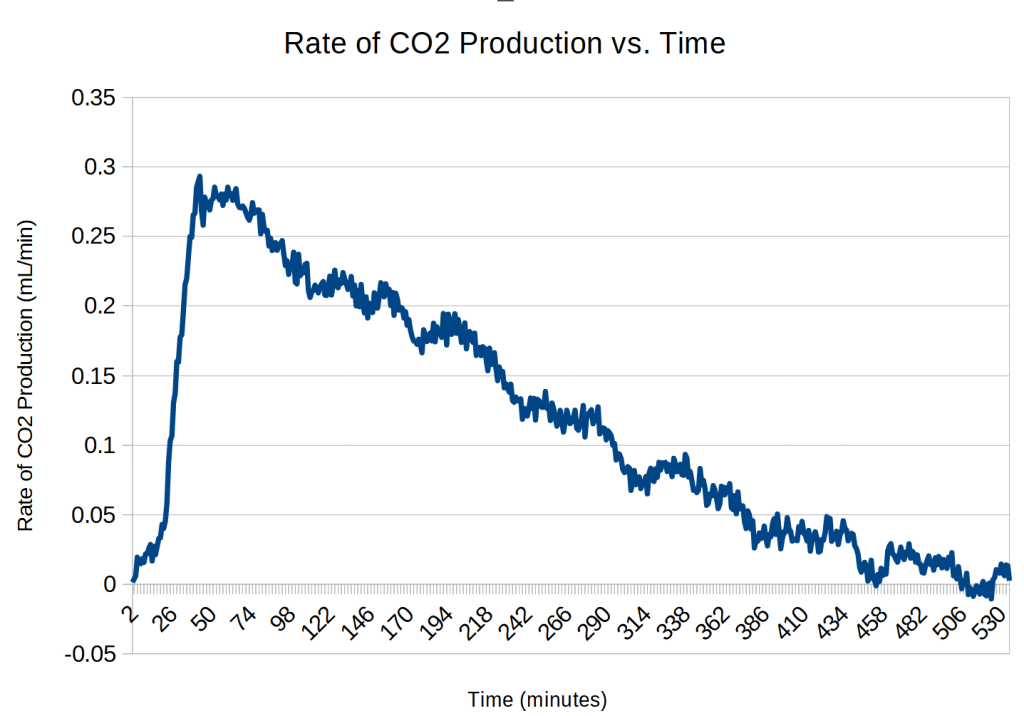
There is then a sudden transition are 43 minutes when gas production occurs at a more rapid and constant rate for almost 3 hours. This appears to be zero-order kinetics4 due to the yeast being saturated with sucrose. The slope of the red line is 0.23 mL/minute.
Beginning at about 3 hours after the start of linear production, first order kinetics begins to show up as the decline in sucrose concentration becomes the rate-limiting step. The yellow curve has a k value of 0.0094 and has the equation
y = 67 – 248e-0.0094t.

The rate of CO2 production was obtained by calculating the difference between the volumes of CO2 produced at each minute. This produced very noisy data. This noise was reduced by using a 20-minute running average.5
Trial 5: Checking Reproducibility
Experimental Design
The design of the experiment was the same as in trial 4.
Materials Used
0.25 g sucrose, 0.51 g yeast in 18 mL of warm water
Results of Trial 5
554 data points were recorded over 9.2 hours
The range of load cell readings was 301589 to 329082, a difference of 27493. The conversion factor was 27493/62 = 443 force units/mL.


Here is the rate data:
Analysis of Trial 5
| Trial 4 | Trial 5 | |
| Sucrose used | 0.26 g | 0.25 g |
| Yeast used | 0.5 g | 0.51 g |
| Water used | 19 mL | 18 mL |
| Duration | 9.4 hours | 9.2 hours |
| Data points | 563 | 554 |
| Maximum load cell reading | 329810 | 329082 |
| Minimum load cell reading | 299941 | 301589 |
| Difference | 29869 | 27493 |
| CO2 produced | 67 mL | 62 mL |
| Conversion factor | 446 | 443 |
| Maximum rate of CO2 production | 0.26 mL/min | 0.29 mL/min |
I was happy to see that the two trials produced similar results, particularly the difference in the conversion factor was only 0.7%.
Trail 5 seems to have a much shorter zero-order phase, on the order of 30 minutes, rather than the 2 hours for trial 4.6
Discussion
Quantification of a Child’s Experiment
Growing baker’s yeast and collecting CO2 in a balloon is often recommended as a child’s experiment. However, simple experiments can be quantified and analyzed as part of a serious experiment. The experiment described above would be appropriate for a high school science fair.
Extension of the Experimental Apparatus
The experimental design used could be easily modified to measure the rate of production of other gases, such as the variable production of oxygen by photosynthesis throughout a day, the production of methane from decomposition, or the consumption of oxygen by a candle.
Reproducibility
The results were remarkably reproducible, allowing for multiple trials to be performed and statistically combined to reduce random errors.
Electronic Recording
The combination of an Arduino with a data logger and a transducer to record data automatically has multiple advantages over manual recording, including:
- more data
- data recorded at a consistent interval
- data recorded more accurately
- long experiments without constant monitoring
- repeated experiments without fatiguing the researcher
- data already in digital form, ready for analysis
There are many different types of transducers that can be paired with an Arduino.7
Nonintuitive Measurements
Using a transducer that measures force is not an obvious way to measure the volume of a gas. Creativity and a knowledge of a wide variety of transducers can enable a researcher to design an experiment that records data accurately and automatically.
Skills and Knowledge Required
This experiment involves the intersection of many fields, including:
Biology
- Growing yeast
Chemistry
- Measuring volumes and masses
- Collecting gas over water
- Using the ideal gas equation
- Kinetics
Electronics
- Soldering
- Wiring
Programming
- Adapting an Arduino program
Mathematics
- Logarithms
Cost
The electronic components needed for this experiment add to its cost. However, these can be re-used for other experiments.
| Component | Cost |
| Arduino UNO | about $24 for an original, as low as $9 for a clone |
| Adafruit Data Logger8 | $14 |
| Load Cell and HX711 amplifier module | about $7 |
Footnotes
- For more explanation on how I use the ESP32-CAM, see Mannitol crystals ↩︎
- Arduino with Load Cell and HX711 Amplifier (Digital Scale) | Random Nerd Tutorials ↩︎
- A modification of the experiment to test this idea would be to soak the yeast in water for 40 minutes before adding the sucrose. I would expect the CO2 production to take off immediately. ↩︎
- Rate equation – Wikipedia ↩︎
- The noise could possibly be reduced by modifying the Arduino code to average 10 readings within each minute, 1 second apart, and recording that average. ↩︎
- It would be interesting to see if the oscillations in the curve disappeared with repeated trials or were a systematic issue, perhaps related to the cycling of the house’s heating system. ↩︎
- Comidox 37/Set Sensor Assortment Kit 37 in 1 Sensor Module Starter Kit for Arduino MCU Educ(Infrared/Temperature/Avoid Obstacle/Buzzer Sensor etc): Amazon.com: Industrial & Scientific ↩︎
- Adafruit Assembled Data Logging shield for Arduino : ID 1141 : Adafruit Industries, Unique & fun DIY electronics and kits ↩︎
Code
#include "SD.h"
#include "HX711.h"

// A simple data logger for the Arduino analog pins
#define LOG_INTERVAL  60000 // mills between entries
#define ECHO_TO_SERIAL   1 // echo data to serial port
#define WAIT_TO_START    0 // Wait for serial input in setup()


// HX711 circuit wiring
const int LOADCELL_DOUT_PIN = 2;
const int LOADCELL_SCK_PIN = 3;

// for the data logging shield, we use digital pin 10 for the SD cs line
const int chipSelect = 10;

// the logging file
File logfile;

HX711 scale;

int dataCounter = 0;
char filename[] = "YEAST000.CSV"; //the file name must have 8 characters

void error(char *str)
{
  Serial.print("error: ");
  Serial.println(str);

  while(1);
}

void setup(void) {
  Serial.begin(57600);
  Serial.println();
  scale.begin(LOADCELL_DOUT_PIN, LOADCELL_SCK_PIN);

#if WAIT_TO_START
  Serial.println("Type any character to start");
  while (!Serial.available());
#endif //WAIT_TO_START

  // initialize the SD card
  Serial.print("Initializing SD card...");
  // make sure that the default chip select pin is set to
  // output, even if you don't use it:
  pinMode(10, OUTPUT);

  // see if the card is present and can be initialized:
  if (!SD.begin(chipSelect)) {
    Serial.println("Card failed, or not present");
    // don't do anything more:
    return;
  }
  Serial.println("card initialized.");

  // create a new file

  for (uint8_t i = 0; i < 100; i++) {
    filename[6] = i/10 + '0';
    filename[7] = i%10 + '0';
    Serial.println(filename);
    if (! SD.exists(filename)) {
      // only open a new file if it doesn't exist
      logfile = SD.open(filename, FILE_WRITE);
      break;  // leave the loop!
    }
  }

  if (! logfile) {
    error("couldnt create file");
  }

  Serial.print("Logging to: ");
  Serial.println(filename);
}

void loop(void)
{
  // delay for the amount of time we want between readings
  delay((LOG_INTERVAL -1) - (millis() % LOG_INTERVAL));

  if (scale.is_ready()) {
    long reading = scale.read();
    Serial.println(reading);
    logfile.println(reading);
  } else {
    Serial.println("HX711 not found.");
  }
}
Leave a comment