- Greek and Latin Roots
- Important Points We Discussed
- Details of Things We Discussed
- Kepler’s Third Law
- Things To Do
- Footnotes
Greek and Latin Roots
Here is the list of Greek and Latin roots for this week:
Here is a link to all of the Greek and Latin roots we have discussed.
Test your memory of the Greek and Latin roots that we have discussed with this quiz.
This is the link to the Wikipedia list of Greek and Latin roots.
Important Points We Discussed
Families of Curves
- Different families of curves have different equations.
- The shapes of curves in a family are controlled by one (or a few) parameters.
- A change from one family of curves to another indicates a different phenomenon is occurring.
Science
- Science is not a set of facts about the world.
- Science is not just measuring things.
- Science is the systematic study of the world through making observations and developing general rules that explain those observations.
Logarithms
- The logarithm is the inverse operation of exponentiation.
- 10x = y -> x = log(y)
Log-log Plots
- Log-log plots are used to convert polynomials of the type y = xn into linear equations of the form log(y) = n·log(x), where the exponent, n, becomes the slope of the line.
- Log-log plots can also be used to show values over many orders of magnitude.
Semi-log Plots
- Semi-log plots are used to convert exponential curves of the type y = bx into linear equations of the form log(y) = log(b)·x, where the slope of the line becomes log(b).
Details of Things We Discussed
Greek and Latin roots
Helium
Correction: I said that helium was discovered by a woman. This was incorrect. Here is the real story.
Helium was first detected as an unknown, yellow spectral line signature in sunlight during a solar eclipse in 1868 by Georges Rayet, Captain C. T. Haig, Norman R. Pogson, and Lieutenant John Herschel, and was subsequently confirmed by French astronomer Jules Janssen. Janssen is often jointly credited with detecting the element, along with Norman Lockyer. Janssen recorded the helium spectral line during the solar eclipse of 1868, while Lockyer observed it from Britain. However, only Lockyer proposed that the line was due to a new element, which he named after the Sun. The formal discovery of the element was made in 1895 by chemists Sir William Ramsay, Per Teodor Cleve, and Nils Abraham Langlet, who found helium emanating from the uranium ore cleveite, which is now not regarded as a separate mineral species, but as a variety of uraninite. In 1903, large reserves of helium were found in natural gas fields in parts of the United States, by far the largest supplier of the gas today.
Cecilia Payne-Gaposchkin (1900-1979) wrote a PhD thesis theorizing that the sun was made mostly of hydrogen and helium. This idea was initially rejected because it was contrary to the accepted theory that the concentration of elements in the sun had the same ratio as the elements on Earth.
See Women of Science
Phosphorus
Although several elements were known in ancient times, phosphorus was the first element with a known discoverer and date of discovery. It was discovered in 1669 by Hennig Brand, a German chemist. Brand’s process originally involved letting urine stand for days until it gave off a terrible stench. Then he boiled it down to a paste, heated this paste to a high temperature, and led the vapors through water, where he hoped they would condense to gold. Instead, he obtained a white, waxy substance that glowed in the dark.
Phosphorus roughly translates to mean “light bearer” or “the bringer of light”.
Discovery of the Elements
See Discovery of chemical elements – Wikipedia
Several scientists are recognized for discovering multiple elements. They often used a new technique which opened up the possibility of isolating multiple elements.
| Name | Technique used | Number of elements discovered | Elements discovered |
| Glenn Seaborg | Bombardment of heavy elements using a particle accelerator to produce heavier elements | 10 | plutonium, americium, curium, berkelium, californium, einsteinium, fermium, mendelevium, nobelium, seaborgium |
| Humphrey Davy | Electrolysis to separate compounds into their elements | 8 | potassium, sodium, calcium, strontium, barium, magnesium, boron |
| William Ramsay | Fractional distillation of liquid air | 4 | argon, neon, krypton, xenon |
Michael Faraday
Michael Faraday was a scientist who investigated electricity in the 1800s. He invented an early electric motor and developed the law of electromagnetic induction. He worked under Humphrey Davy.
Quantitative vs. Qualitative Observations
Quantitative descriptions are descriptions made with numbers. Quantitative descriptions include an object’s mass, length, electrical conductivity, etc.
Qualitative descriptions are descriptions of characteristics than cannot be measured. Qualitative descriptions include an object’s shape, color, texture, etc.
For example, a tall horse is quantitatively different than a short horse. But a horse is qualitatively different than a cow.
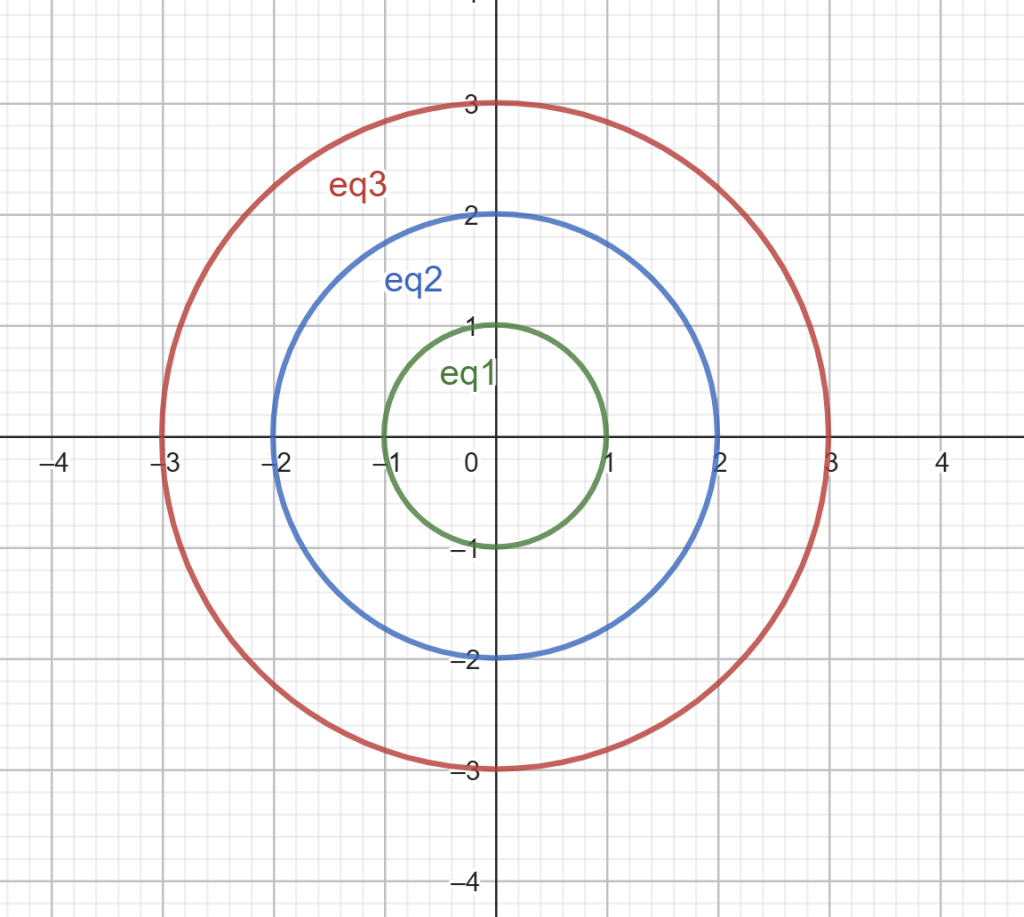
Families of Curves
The full equation for a circle is (x-h)2 + (y-k)2 = r2. Different circles are formed by varying the parameters h, k, and r. h shifts the circle left and right, k shifts the circle up and down, and r determines the size of the circle.
The exponential equation is y = bx. Varying the parameter b varies the rate at which the curve rises.

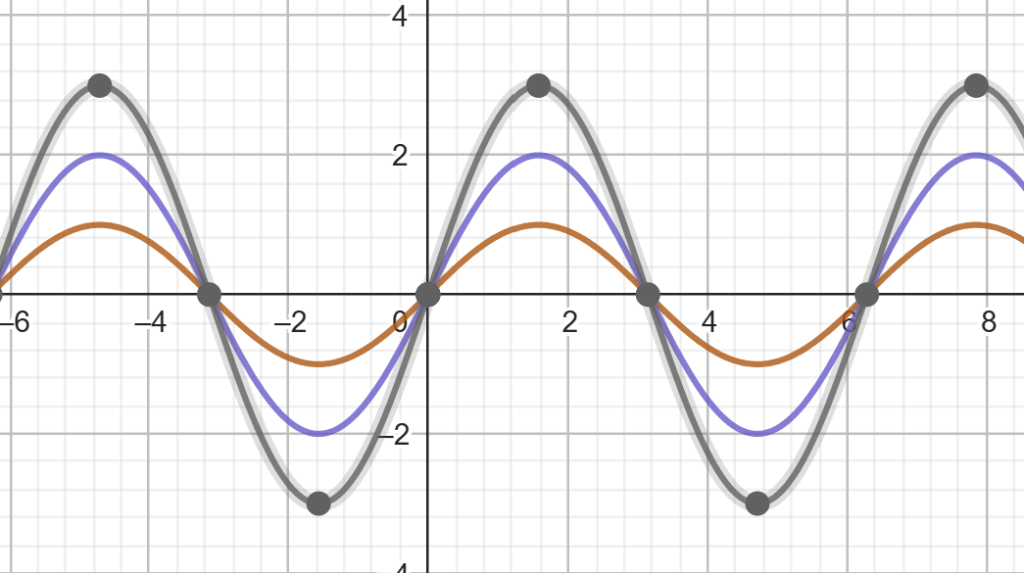
The amplitude of a sine wave, y = A sin(x), varies by varying the parameter A.
Differentiable Curves
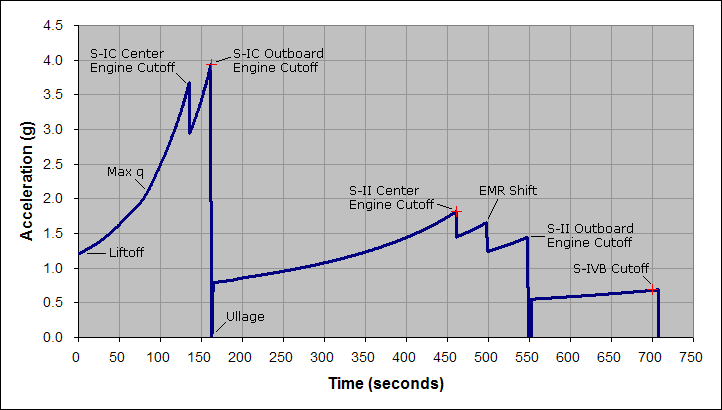
Most physical processes are governed by equations that have a derivative1 at every point. This means that the graph of the equation will not have any sharp bends.
A sharp bend in a curve indicates that there is a different process going on.
What is Science?
Science is not a set of facts. For instance, identifying a rare tropical beetle as Goliathus albosignatus feels scientific, but it is no more science than identifying a flower as a tulip. It does not matter how many facts or how obscure the facts are, the collection of facts is not science. (Unfortunately, “science” taught in school can feel like memorizing a bunch of facts.)
Science is also not the act of measuring. For instance, measuring the mass of a proton may feel scientific but it is no more science than weighing yourself on the bathroom scale, which doesn’t feel very scientific.
Science is the systematic study of the world by making observations to develop general rules to explain how the world works and make predictions about what will happen.
For instance, when I made the video of the mannitol crystalizing, I was not “doing science”. However, in making the video and then analyzing the results, I produced a graph that looks like this:
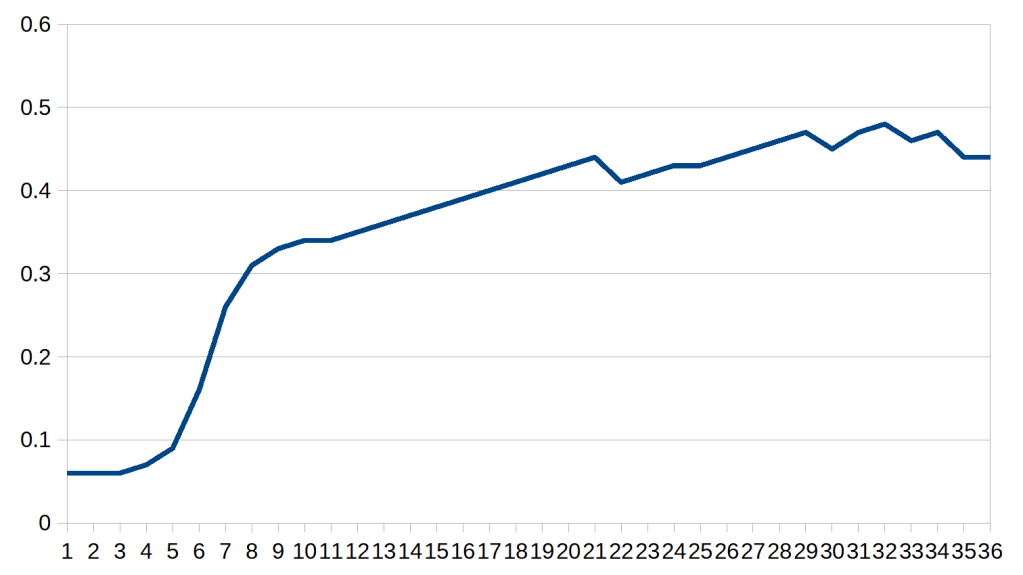
I had predicted that the curve would look like a logistic curve, which initially it did. However, I discovered that the logistic curve changes into a linear relationship which than changes into an irregularly oscillating relationship. Each of these changes indicates a different process happening2. In recognizing this and coming up with an explanation for why this happens, I am “doing science”.
Orders of Magnitude
An “order of magnitude” is a range within a factor of 10. For instance, the numbers 30, 46, and 83 are all in 1 order of magnitude, but the numbers 20, 150, and 1806 cover three orders of magnitude.
Many physical phenomena can be described over multiple orders of magnitude. For instance, the wavelength of electromagnetic radiation can extend from many kilometers for radio waves to nanometers for gamma rays. The pH scale covers many orders of magnitude of hydrogen concentration.
On the other hand, many familiar phenomena occur within a single order of magnitude. For instance, although some runners are much faster than others, no one runs a marathon 10 times faster than someone else.3
Most measuring instruments are only useful over a few orders of magnitude. For instance, a meter stick could be used to measure millimeters but nothing smaller.
Logarithms
| x | 10x |
| 2 | 100 |
| 3 | 1,000 |
| 4 | 10,000 |
| 5 | 100,000 |
->
| x | log(x) |
| 100 | 2 |
| 1,000 | 3 |
| 10,000 | 4 |
| 100,000 | 5 |
If there is an exponential relationship, y = 10x, then the logarithm tells us what x value will give the y value. The log function is the inverse function of exponentiation. It reverses exponentiation in the same way that subtraction reverses addition and division reverses multiplication.
As an example, you would expect log(325) to be greater than 2, since log(100) = 2, but less than 3, since log(1000) = 3. The log(325) = 2.511…
Inverse functions
| Function | Inverse Function | Example |
| addition | subtraction | x + 5 – 5 = x |
| multiplication | division | (5·x)/5 = x |
| exponentiation | logarithm | log(10x) = x |
Rules of Exponents
b3 = b·b·b and b2 = b·b and b3b2 = b·b·b·b·b·b = b5. In general, it can be seen that bmbn = b(m+n).
A similar argument can be made to show that bm/bn = b(m-n).
Using b(m-n) = bm/bn, we can get b0 = b(m-m) = bm/bm = 1.
Using b(m-n) = bm/bn, we can get b-n = b(0-n) = b0/bn = 1/bn.
- Rules of exponents:
- (bm)(bn) = bm+n
- bm/bn = bm-n
- (bm)n = bmn
- b-n = 1/bn
- b0 = 1
- b1 = b
- Rules for logarthims:
- log(xm) = m log(x)
- log(xy) = log(x) + log(y)
Log-log Plots
Log-log plots are used to convert polynomial curves into straight lines.
Taking the logarithm of each side of the equation y = x2 gives log(y) = 2 log(x), which is a linear equation of log(x) and log(y).4
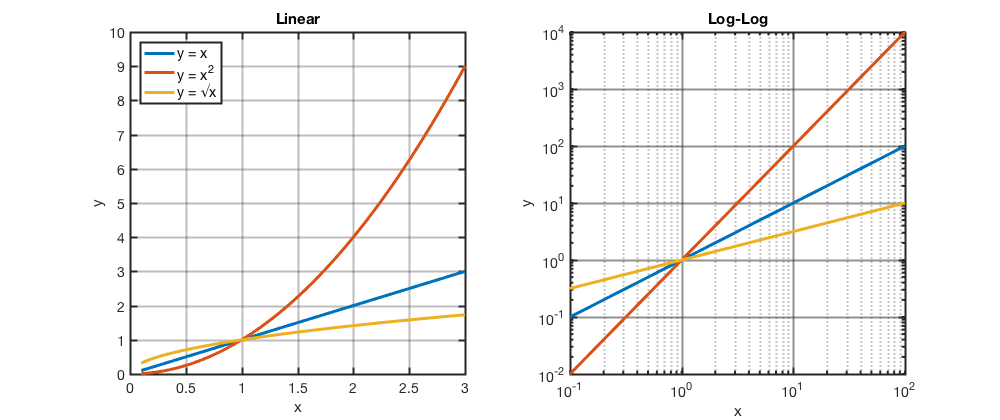
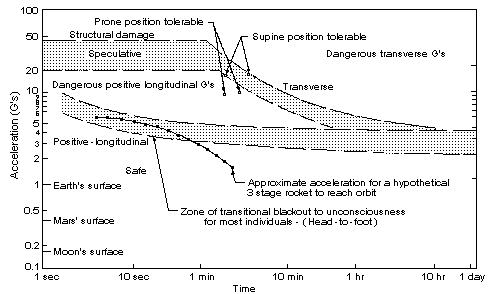
Log-log plots can often be recognized by the uneven distribution of grid lines. However, some graphs, like the one below, do not show grid lines. The most telling feature is the scale along both the x- and y-axis goes up exponentially.
It is important to realize that just like an exponential equation approaches the x-axis asymptotically but never touches it, there is no “zero” on a log-log plot.
Semi-log Plots
Semi-log plots are used to convert exponential curves into straight lines.
Taking the logarithm of each side of the exponential equation y = bx gives log(y) = log(b)·x, which is a linear equation of x and log(y), with log(b) as the slope of the line.
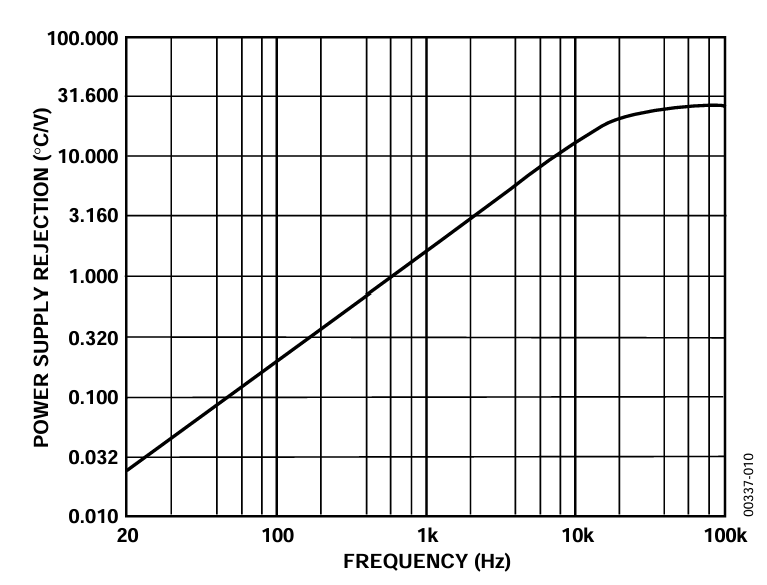
Semi-log plots are recognizable by their uneven distribution of grid lines along one axis but not the other axis.

If data extends over several orders of magnitude, a semi-log plot may be used even if the data does not have an exponential relationship.
Kepler’s Third Law
Johannes Kepler had three laws of planetary motion.
His third law states:
The square of a planet’s orbital period is proportional to the cube of the length of the semi-major axis of its orbit.
In other words: T2 = ka3.
Rearranging this gives, T = ka3/2.
The following log-log plot was created by plotting the log of the planet’s distance from the sun on the x-axis and the log of the planet’s orbital period on the y-axis. (I have included the dwarf planets Pluto and Ceres.)

The slope of the line is 3/2. In this case, because the orbital period is measured in Earth-years and the distance is measured in AU5, k = 1. Otherwise, the slope would also be affected by what k is.
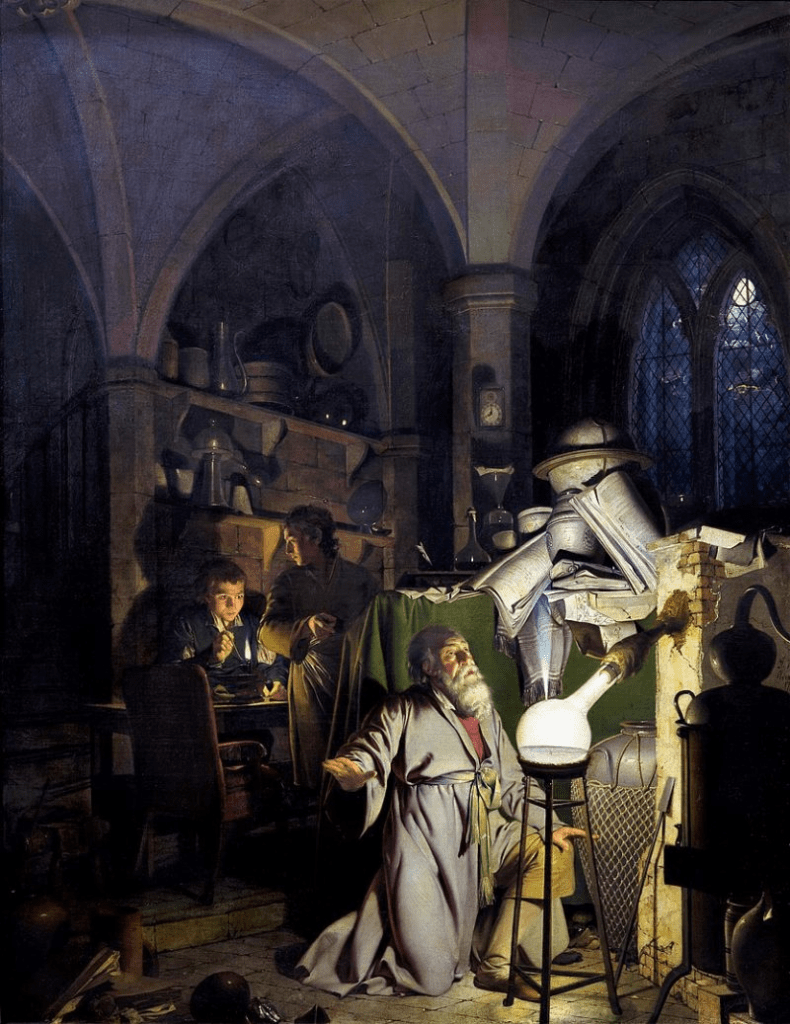
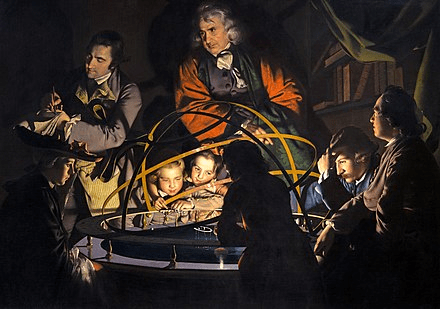
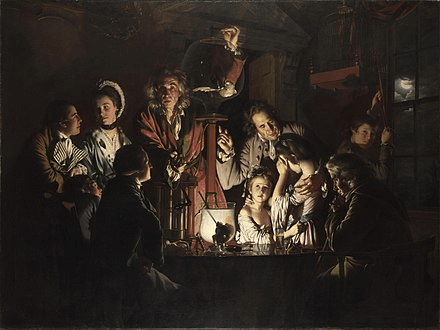
Joseph Wright of Derby
Joseph Wright was a painter in the 1700s. He was known for paintings of science experiments and his use of light.
Things To Do
- Fill out the list of Greek and Latin roots.
- Write in the meaning of each root
- Give at least one example of each, be prepared to give its actual definition and the way that it is related to the root word
- Example: If I gave you the root “onym”, you could give the word “synonym” which has the definition of two words with the same meaning. The two roots in the word “syn” and “onym” mean “same name”, indicating two words that name the same thing.
- Fill out the blank space at the bottom with your own root that you have discovered. This will likely come from some of the example words that you have already written. Give a different example than what you have used.
- Example: syn- means “same”, example word “synchronous”
- Presentation
- Research your topic of choice and be prepared to give a 5-minute presentation on the topic, geared toward people your age level.
- Include the background information needed for someone who does not know the topic as well as you.
- Be prepared to talk about how you found this information.
Next time we will meet on 1/16/25.
Footnotes
- Finding a derivative of a function is one of the major tasks of calculus. The derivative can be thought of as the slope of a line that touches a curve at a single point. “Normal” curves have only one possible line that touches the curve at a given point, but when a curve has a sharp bend at a single point, then multiple lines can pass through that one point. There is no way to determine the derivative at that point. ↩︎
- I speculate that the first part, the logistic relationship, is due to conditions initially becoming more and more favorable for crystal formation but then the concentration of mannitol decreases. This was expected. However, I speculate that the second part, the linear relationship, is due to the water becoming so shallow that the crystals are no longer free to float around and aggregate, but instead the crystals simply fall where they form. Because it does not make physical sense for the amount of crystals to oscillate up and down, I speculate that the last part is an artifact of my analysis and due to the reflection of light off the water as the crystals are starting to dry out. ↩︎
- The fastest marathon time is about 2 hours. Although it might take you 20 hours to go 26 miles, your speed would only be 1.3 mph, the speed of a casual walk, and could not be considered running. ↩︎
- The linear equation might be more easily seen and understood if we consider different variables: v = u2. Taking the logarithm of each side gives log(v) = 2 log(u). Now, substitute x = log(u) and y = log(v). This gives y = 2x, a linear equation of the form y = mx + b, where b = 0 and m, the slope of the line, is 2. ↩︎
- AU = astronomical units. 1 AU is the average distance from the Earth to the Sun. ↩︎

Leave a comment